Discover how long visitors are spending on your site with Average Time in Site Analytics! This feature surfaces engagement metrics that help you better understand how users interact with your site over a selected time period.
TABLE OF CONTENTS
- What is Average Time in Site Analytics?
- Key Benefits of Average Time Metrics
- Key Metrics
- How To Access Average Time
- Frequently Asked Questions
- Related Articles
What is Average Time in Site Analytics?
Average Time is a dedicated view in Sites → Analytics that shows how long visitors actively spend on pages across funnels, websites, and webinars.
At a glance, you will see KPI cards for Average Time and Exit Before 30 Seconds, plus an interactive trend chart to compare engagement over time.
Key Benefits of Average Time Metrics
- Trend Visibility: Identifies strong and weak engagement points across funnels, websites, and webinars.
- Actionable Prioritization: Provides clearer signals for content, UX, and design optimization.
- Less Guesswork: Reduces guesswork when improving retention and conversions.
- Data Driven Actions: Enables data-backed decisions using real user engagement behavior.
Key Metrics
Average Time
The mean active time per visit across the selected date range and sites. This helps measure general user engagement across the site.
Exit Before 30s
The share of page visits that ended within the first 30 seconds after landing on that page (Bounce Rate). This helps identify short-lived or low-engagement sessions, often caused by unmet expectations, slow load times, or irrelevant content.
Note: Each visit/session is counted independently. Ultra-short visits (<2 seconds) are excluded to reduce noiseHow To Access Average Time
Follow these steps to locate and interact with the Average Time feature within Sites Analytics.
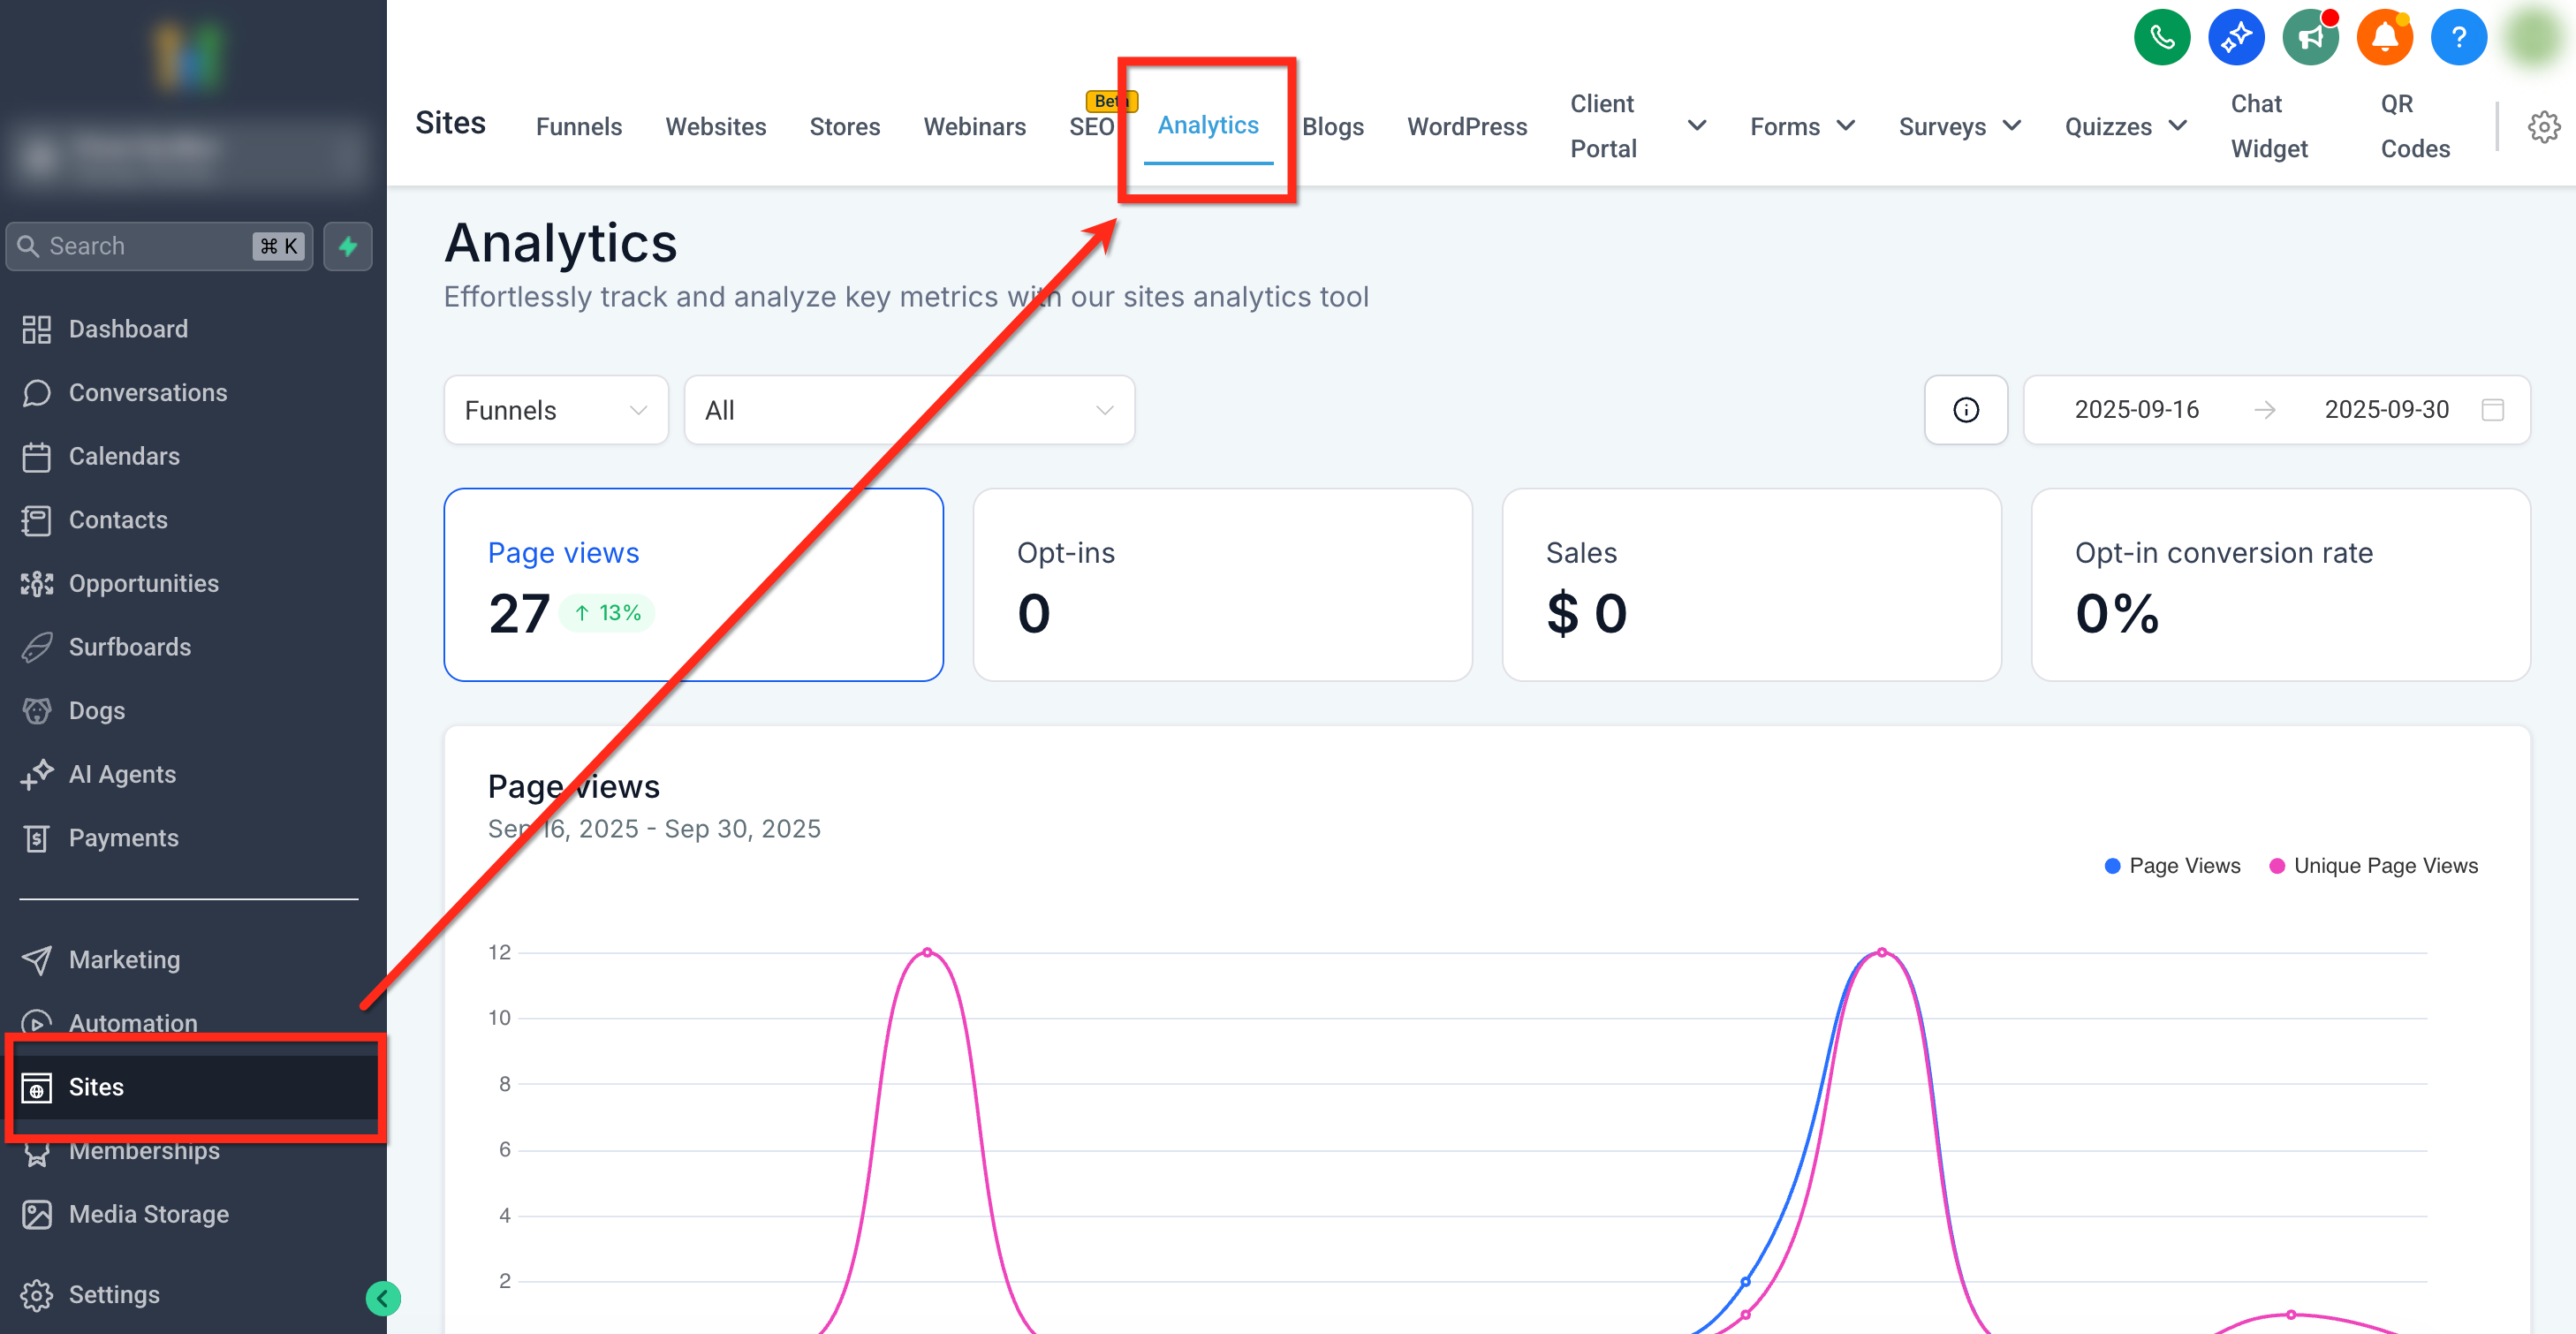
Step 1: Navigate to Analytics
From your sub-account dashboard, use the left-side navigation bar to go to Sites and select the Analytics tab from the top navigation ribbon.
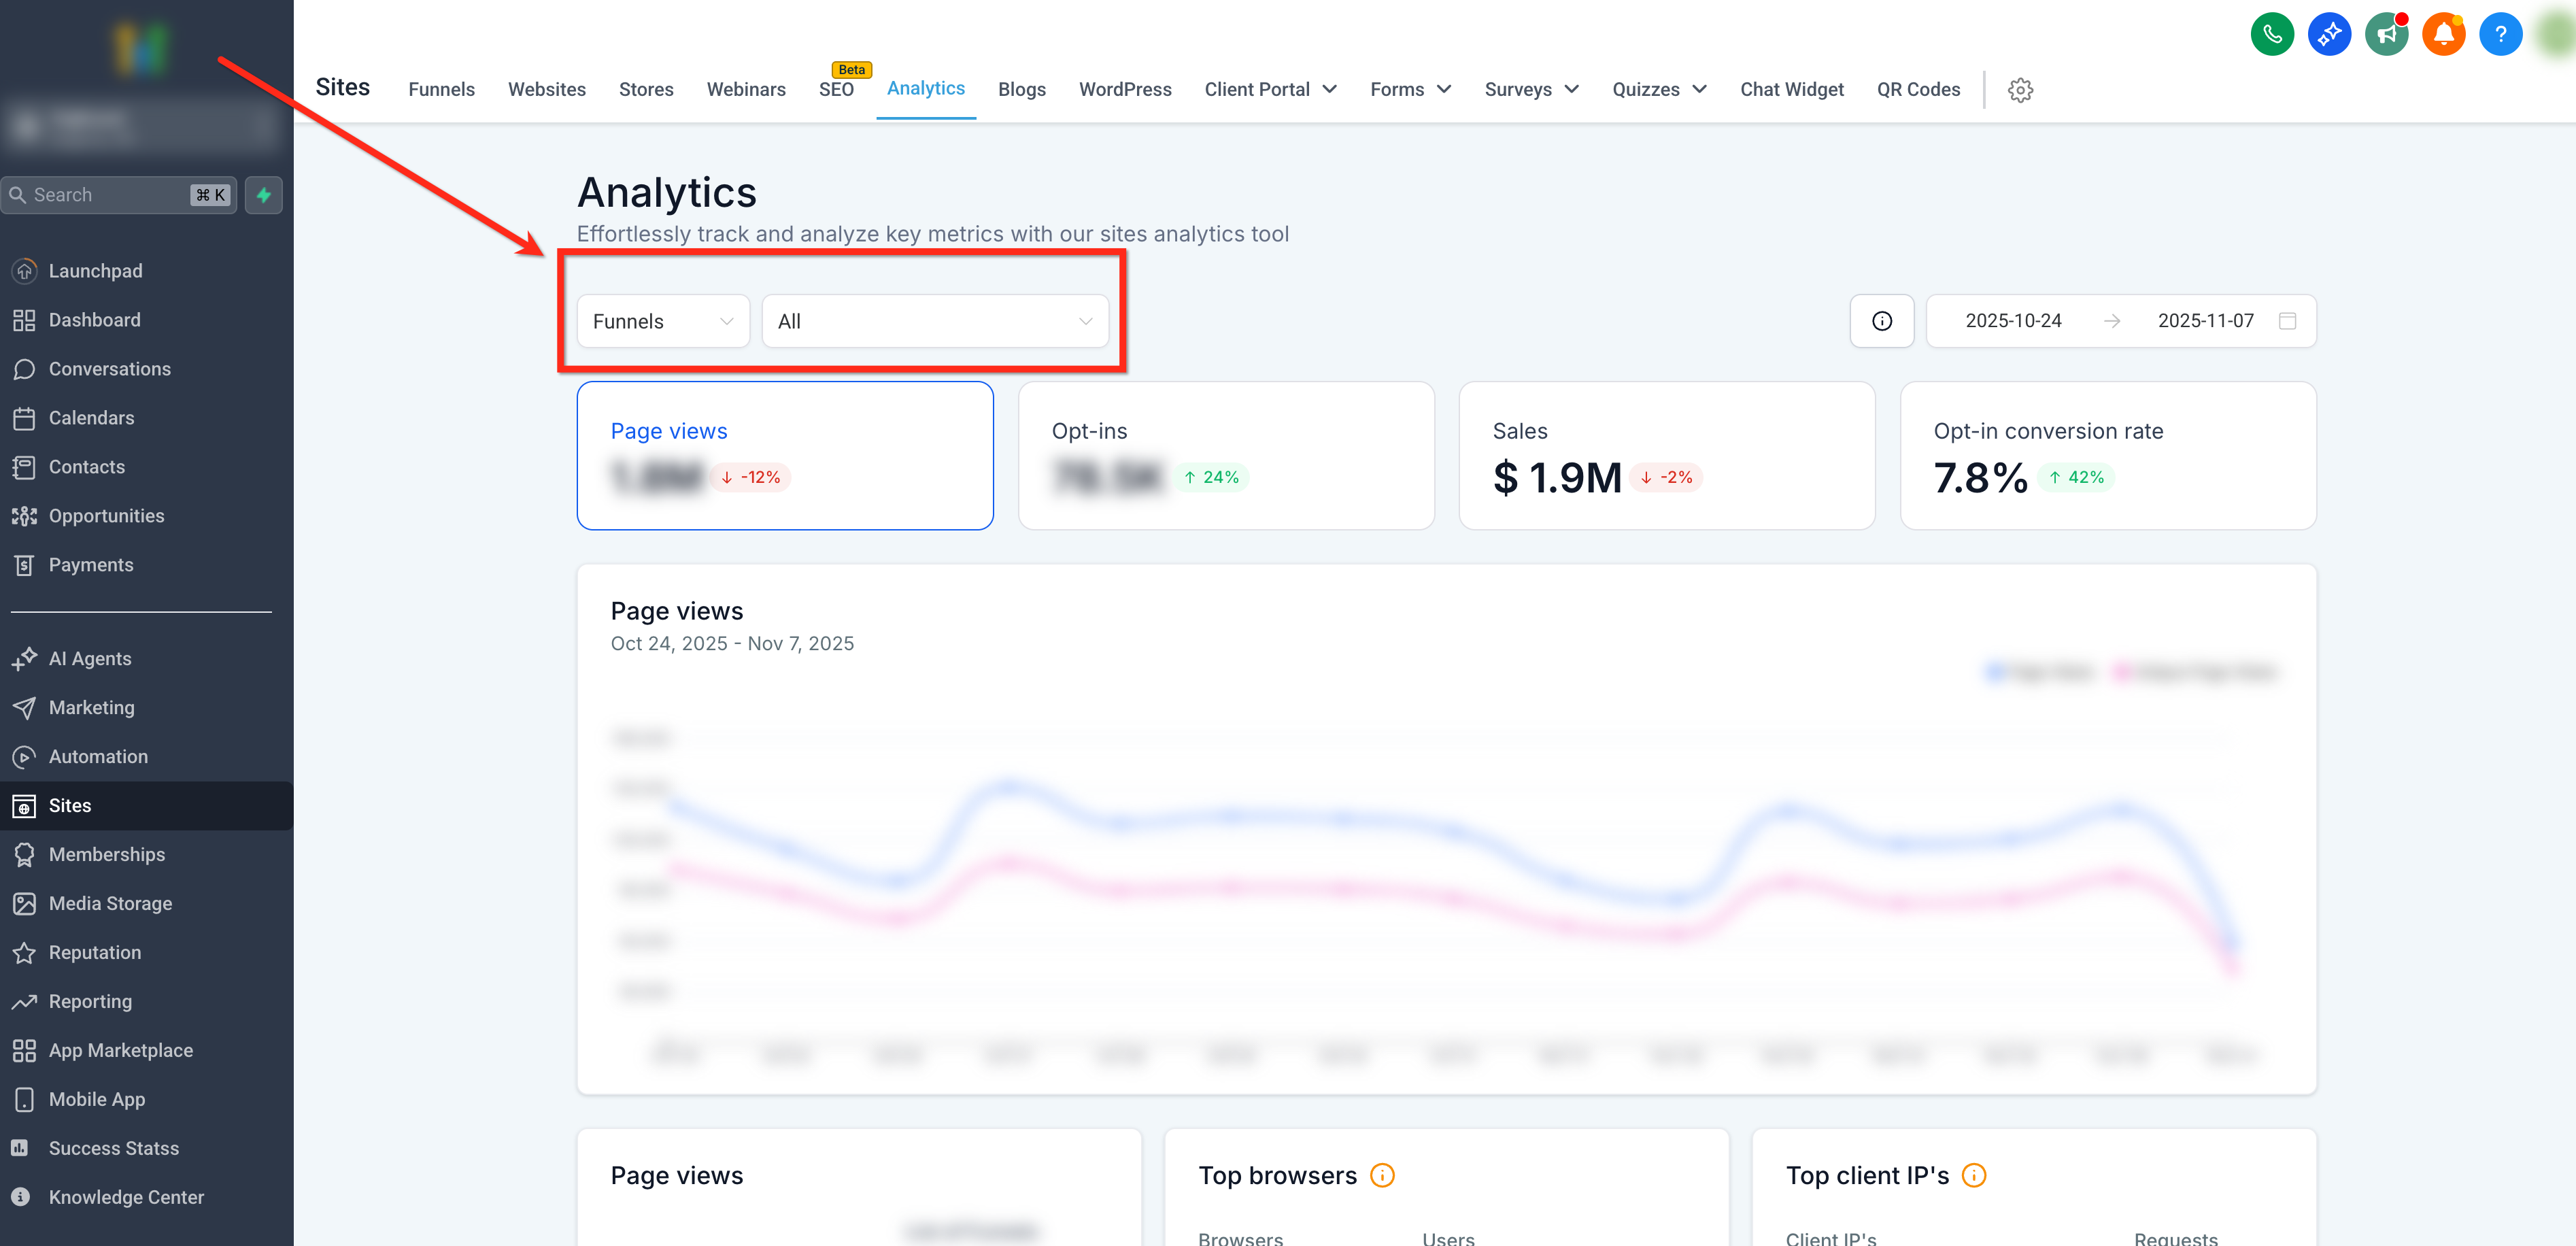
Step 2: Choose Between Funnels or Websites
Use the dropdown at the top-left of the dashboard to select whether you’d like to view data for Funnels, Websites or Webinars. You can optionally filter your results to a specific site using the second dropdown.
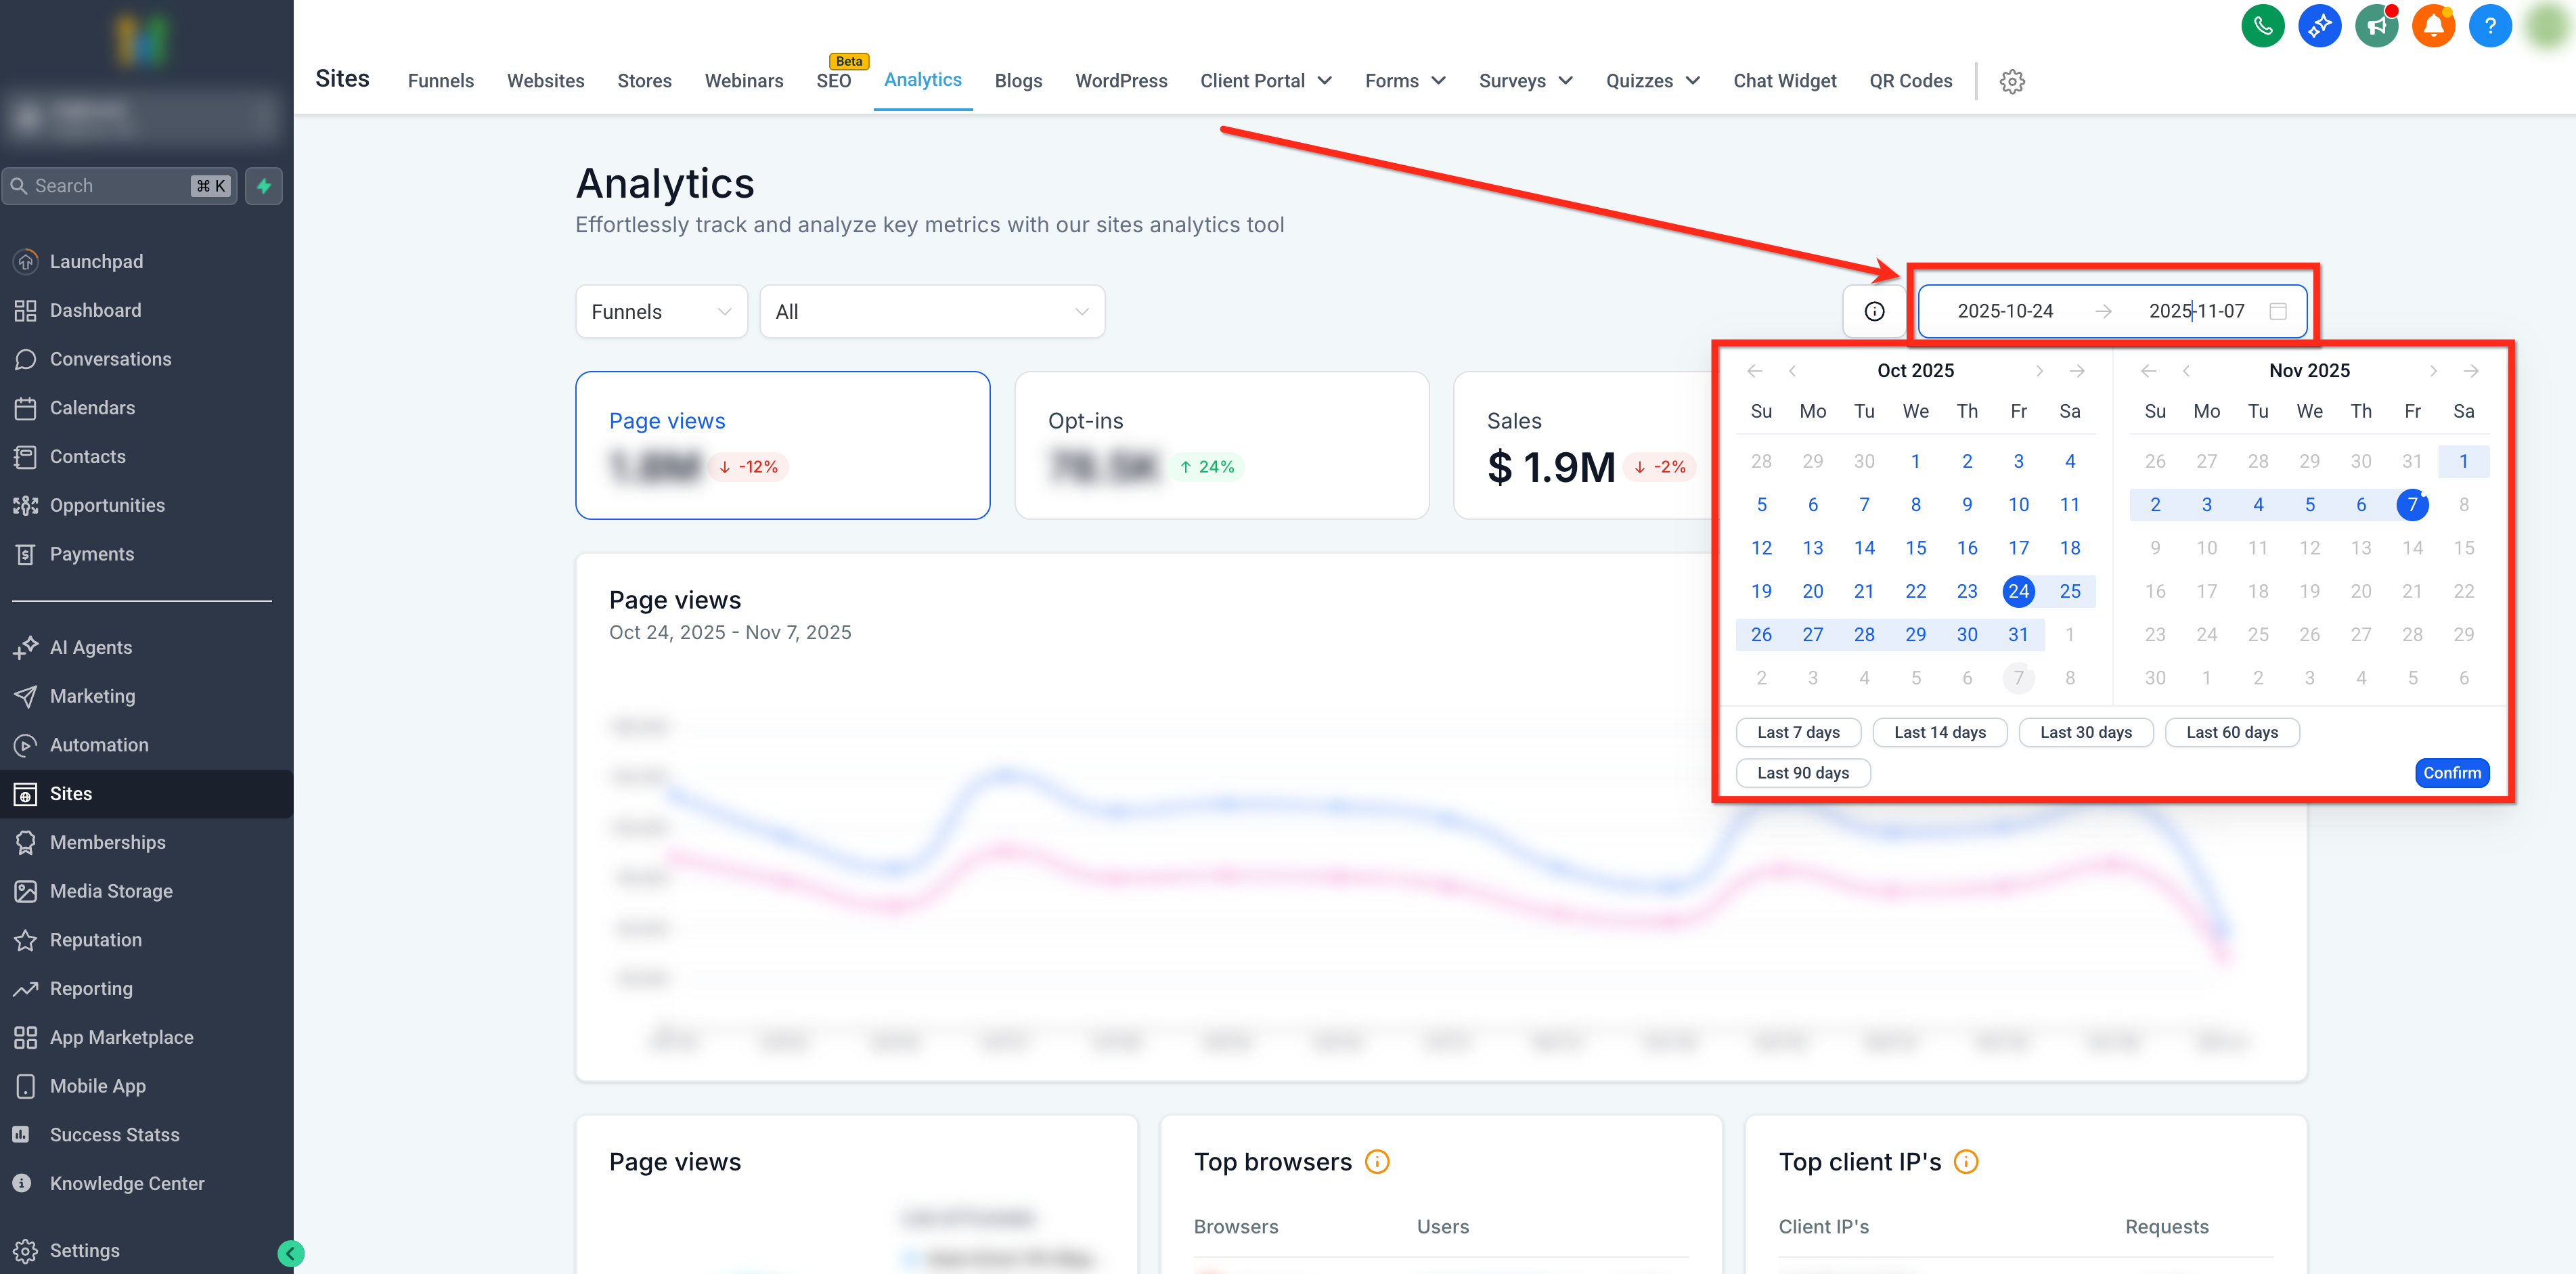
Step 3: Set Your Date Range
Use the Date Selector in the top-right to select a time period to filter the data.
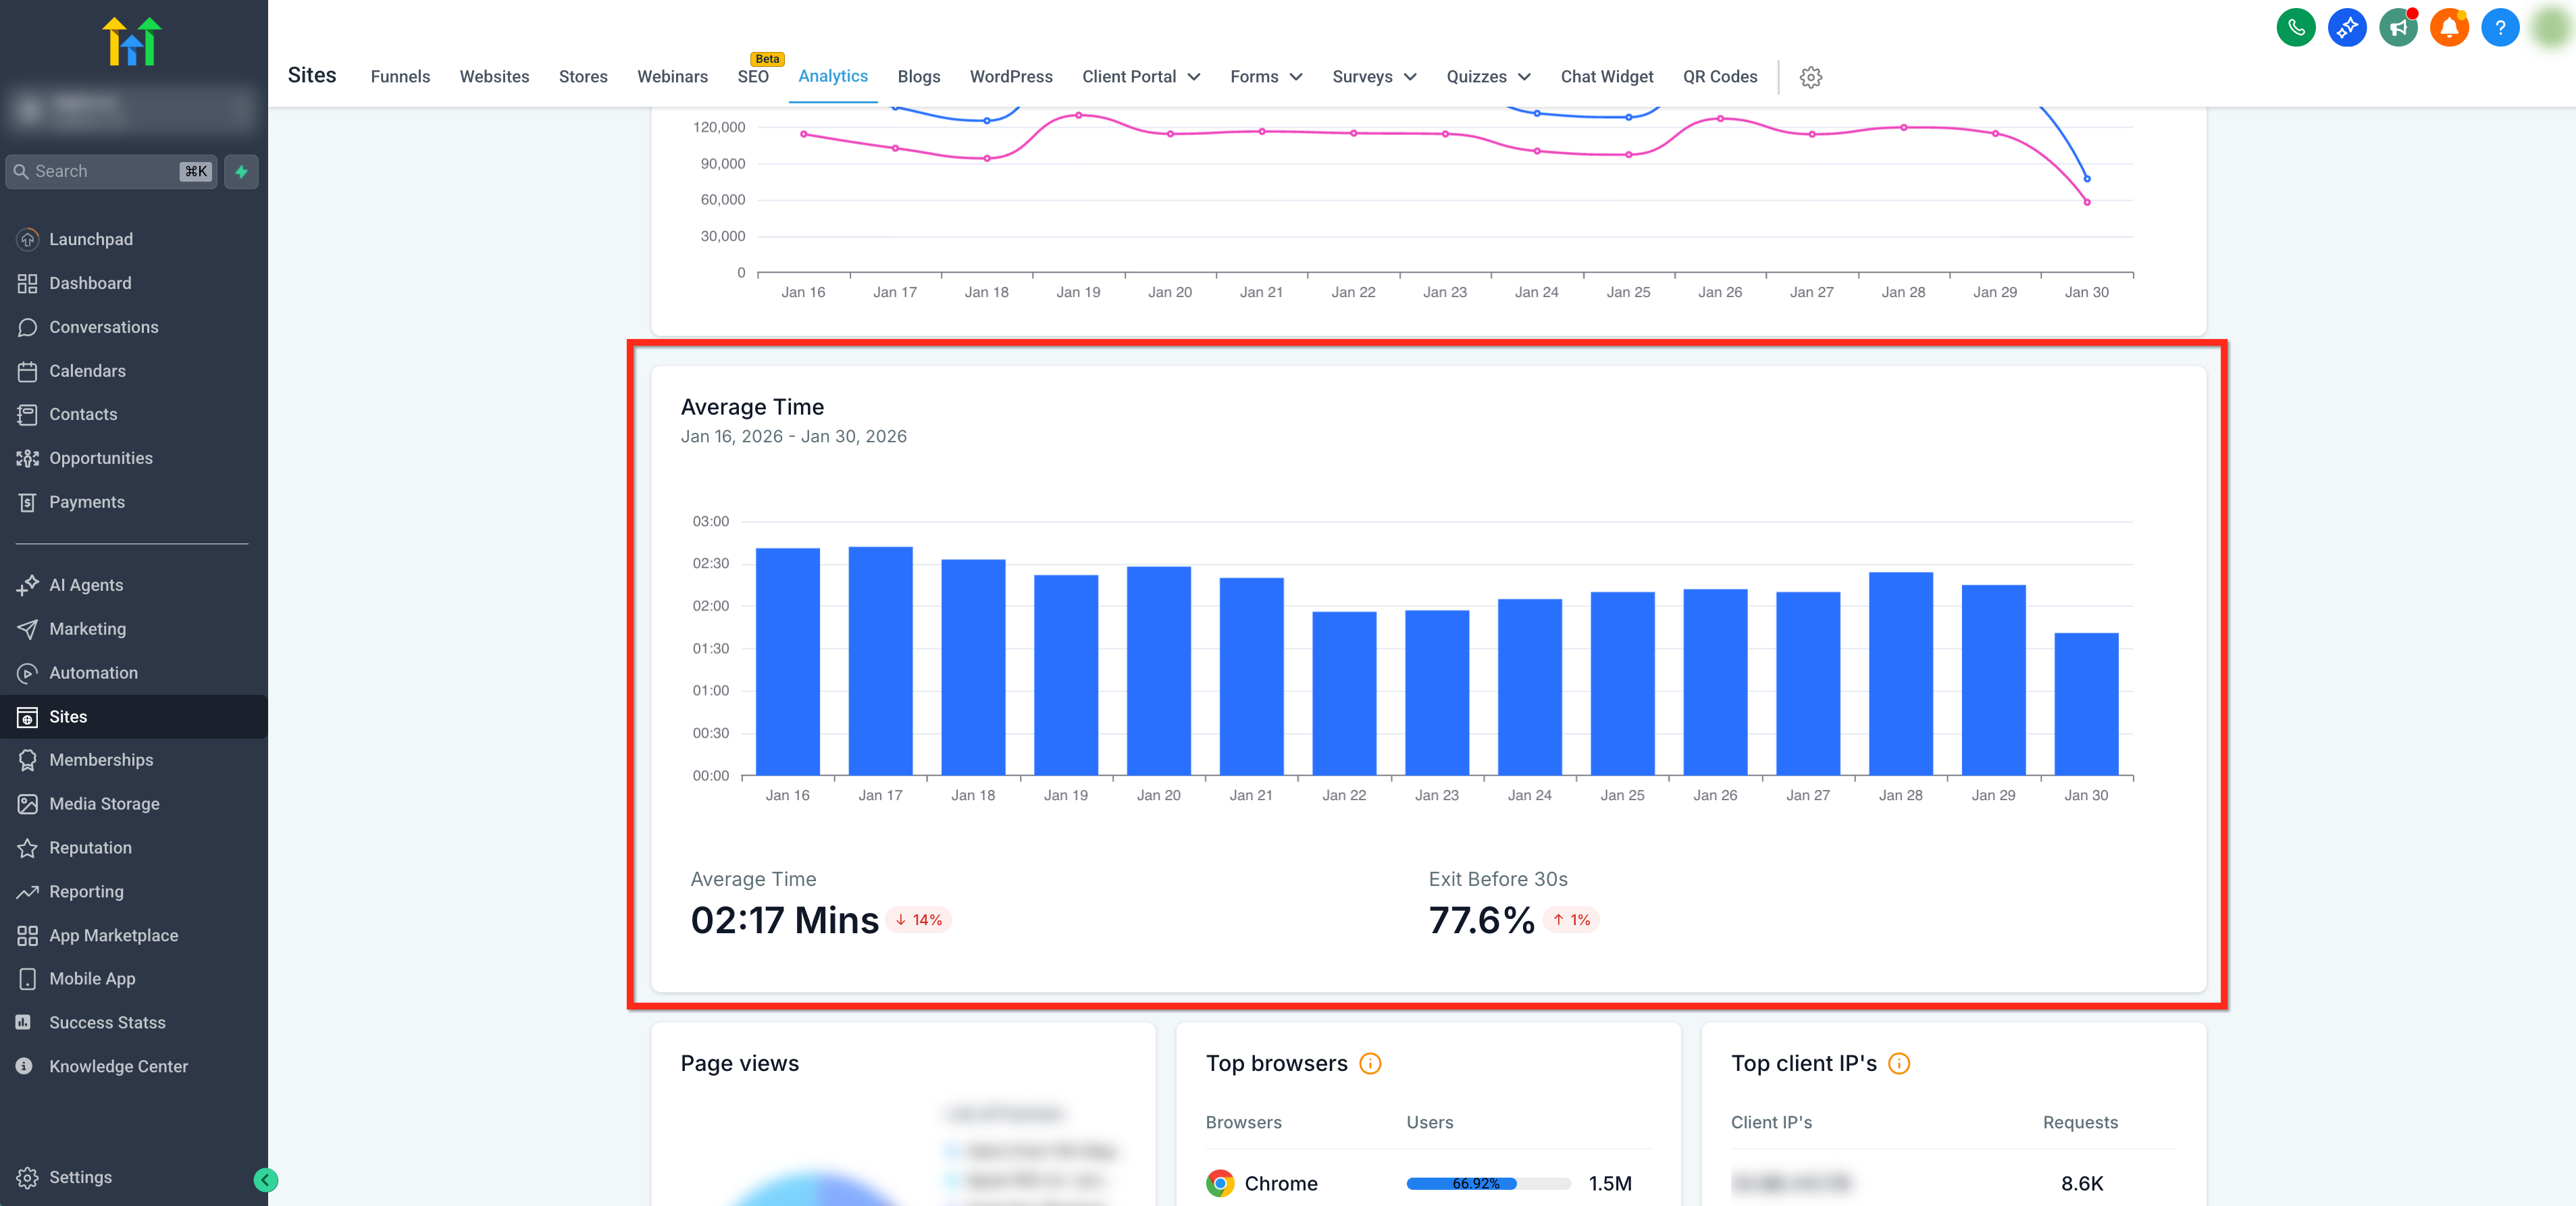
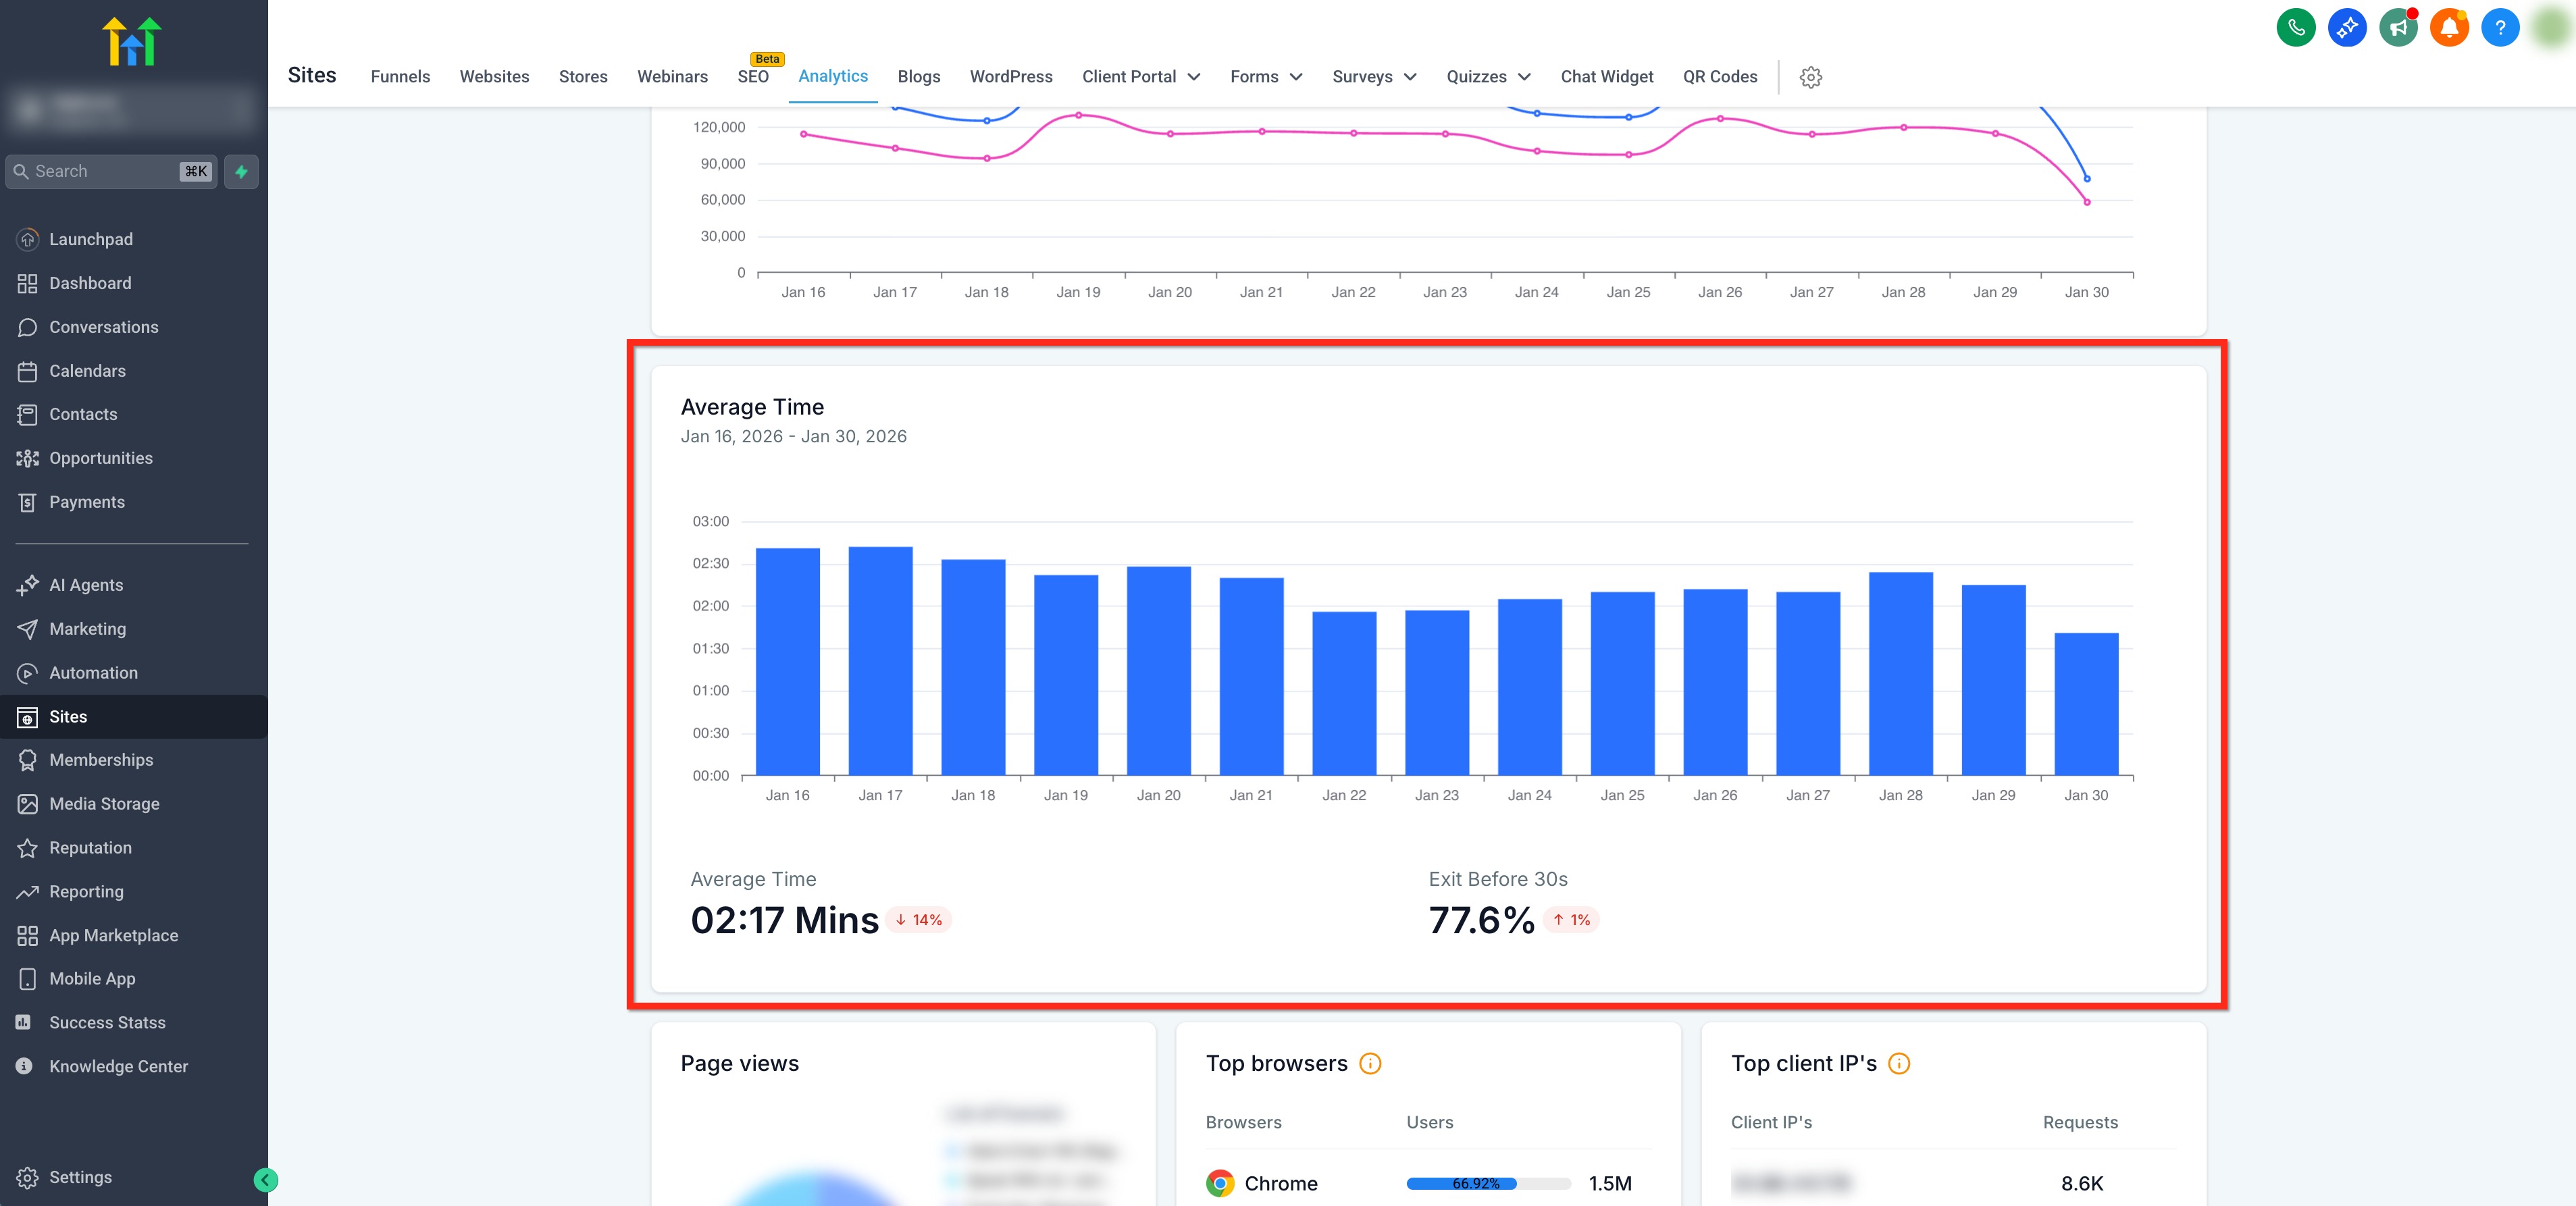
Step 4: View "Average Time" card
Scroll down to the "Average Time" card. From here you can:
- View percentage who exited before 30 seconds.
- View average time spent per session over the selected time period.
- Hover any any column to see average time spent per session during that time period.
Frequently Asked Questions
Q: What types of sites support Average Time metrics?
Funnels, Websites and Webinars
Q: How is idle time treated if a visitor leaves a tab open?
Inactive time is capped so idle tabs don’t inflate your Average Session Duration.
Q: How are ultra‑short visits handled?
Sessions under 2 seconds are excluded to reduce noise from accidental clicks or instant bounces.
Related Articles
Was this article helpful?
That’s Great!
Thank you for your feedback
Sorry! We couldn't be helpful
Thank you for your feedback
Feedback sent
We appreciate your effort and will try to fix the article