Customizing Your Dashboard with Services & Rentals Widgets
This guide walks you through customizing your dashboard with Services and Rentals reporting widgets. You'll learn how to access these widgets from your dashboard editor, configure them for your business needs, and use them to turn booking data into actionable insights.
Whether you run a service-based business tracking staff revenue or a rental operation managing inventory, these widgets help you monitor performance without exporting data or switching between multiple tools.
Services & Rentals widgets are only available when the corresponding scheduling types are enabled in Calendar Settings. If you don't see these widgets in your dashboard editor, check that Services and/or Rentals are enabled for your sub-account. See Section 4 below for detailed steps.
What is Customizing Dashboard with Widgets
Dashboard customization in HighLevel lets you build personalized reporting views by adding, arranging, and configuring widgets that display real-time data from your business operations. Widgets are individual data visualizations—charts, tables, numbers, or lists—that you can place on your dashboard to monitor key metrics without navigating through multiple screens or exporting reports.
When you customize your dashboard, you choose which widgets to display, how they're visualized (bar chart, donut chart, table, etc.), and what data they show by applying filters like date range, staff member, location, or service type. This gives you complete control over what information appears on your dashboard and how it's presented.
Services and Rentals widgets are specialized reporting components designed to track booking performance for two distinct scheduling types in HighLevel's Calendars module:
Services widgets focus on service-based appointments—such as consultations, treatments, classes, or any bookable service delivered by your team. These widgets help you track revenue by service type, monitor staff performance, analyze discount usage, and identify your top-performing offerings. They're ideal for businesses like salons, clinics, consulting firms, fitness studios, and professional services.
Rentals widgets are built for businesses that rent out assets, equipment, vehicles, properties, or spaces. These widgets provide visibility into booking volume, revenue, inventory status, and operational health. You can track active rentals, identify overdue returns, monitor unconfirmed bookings, and analyze which listings generate the most revenue. They're perfect for equipment rental companies, property managers, vehicle rental services, and event space providers.
Both widget types live under the Appointments category in your dashboard editor and are visually distinguished by their icons—Services widgets display a purple wrench icon, while Rentals widgets show a gold key icon.
Key Benefits of Services and Rentals Widgets
Instead of navigating between Calendars, Payments, and Contacts to piece together booking performance, Services and Rentals widgets consolidate all critical metrics in one view. Monitor revenue trends, staff productivity, inventory utilization, and customer booking patterns from a single dashboard, eliminating the need to export reports or switch between multiple tools.
These widgets update in real time, giving you immediate visibility into what's happening in your business right now. Track active rentals currently in progress, identify overdue returns before they become costly, spot unconfirmed bookings that need follow-up, and see which staff members are generating the most revenue today. This real-time visibility enables faster decision-making and proactive issue resolution.
With flexible filtering by staff, location, service, listing, and date range, you can create role-specific dashboards tailored to different audiences. Build an executive dashboard showing total revenue across all locations, a manager view filtered to a single branch, or individual staff dashboards displaying only their personal bookings and earnings. Each team member sees exactly the metrics that matter to their role.
Services and Rentals widgets help you identify revenue opportunities and operational inefficiencies. Discover which services or rental listings drive the most revenue, analyze the impact of coupon codes and discounts on bookings, track cancelled appointment revenue to refine your confirmation workflows, and benchmark performance across locations or staff members. These insights empower you to make informed pricing, staffing, and inventory decisions that directly impact profitability.
How to Access Services & Rentals Widgets
Once Services and Rentals are enabled in Calendar Settings, you can add their widgets to any dashboard from the dashboard editor. These widgets live under the Appointments category and are designed to give you instant visibility into booking performance, revenue, and operations.
- Switch to the sub-account you want to customize
- Click Dashboard in the left navigation
- Create a new dashboard or open an existing one
- Click Edit dashboard to enter edit mode
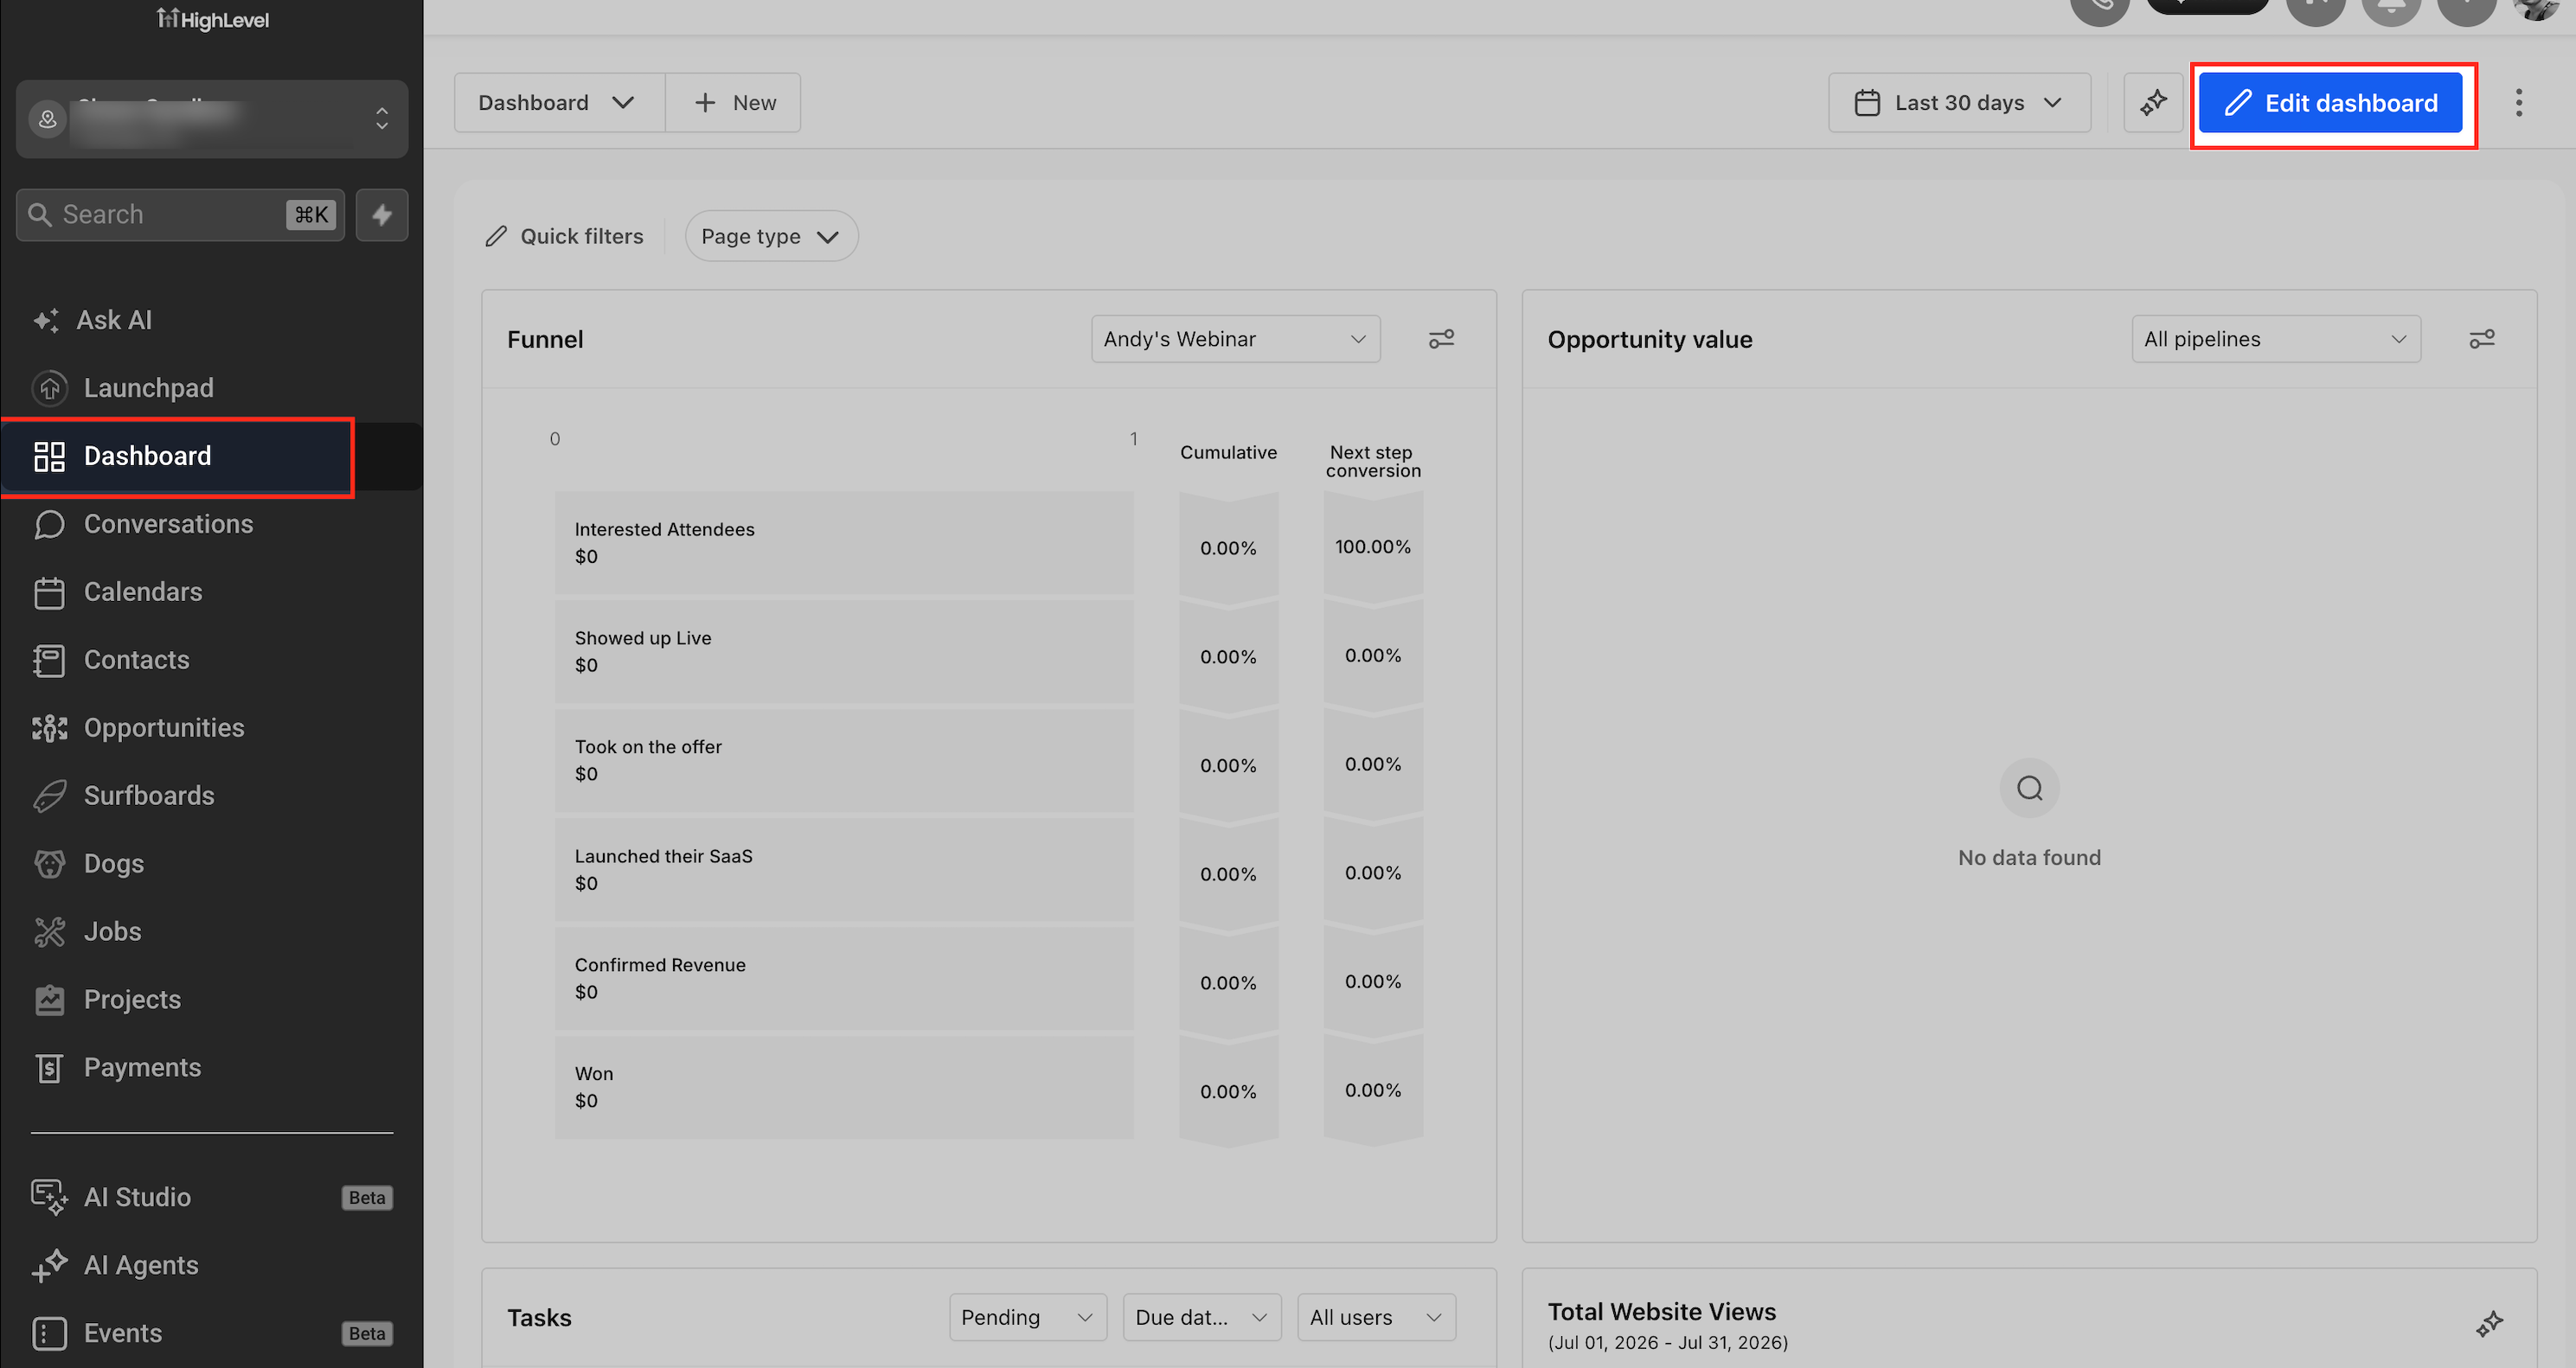
- Click Add widget in the dashboard editor
- In the widget panel, open the Appointments category
- Scroll through the widget list to find Services and Rentals widgets
- Look for the icon to identify widget types:
- Purple wrench icon = Services widgets
- Gold key icon = Rentals widgets
- Blue calendar icon = Meeting appointment widgets
- (Optional) Use the Chart Type filters at the top (All, #, donut, line, bar, funnel, table) to narrow results by visualization style
- Click any widget to add it to your dashboard
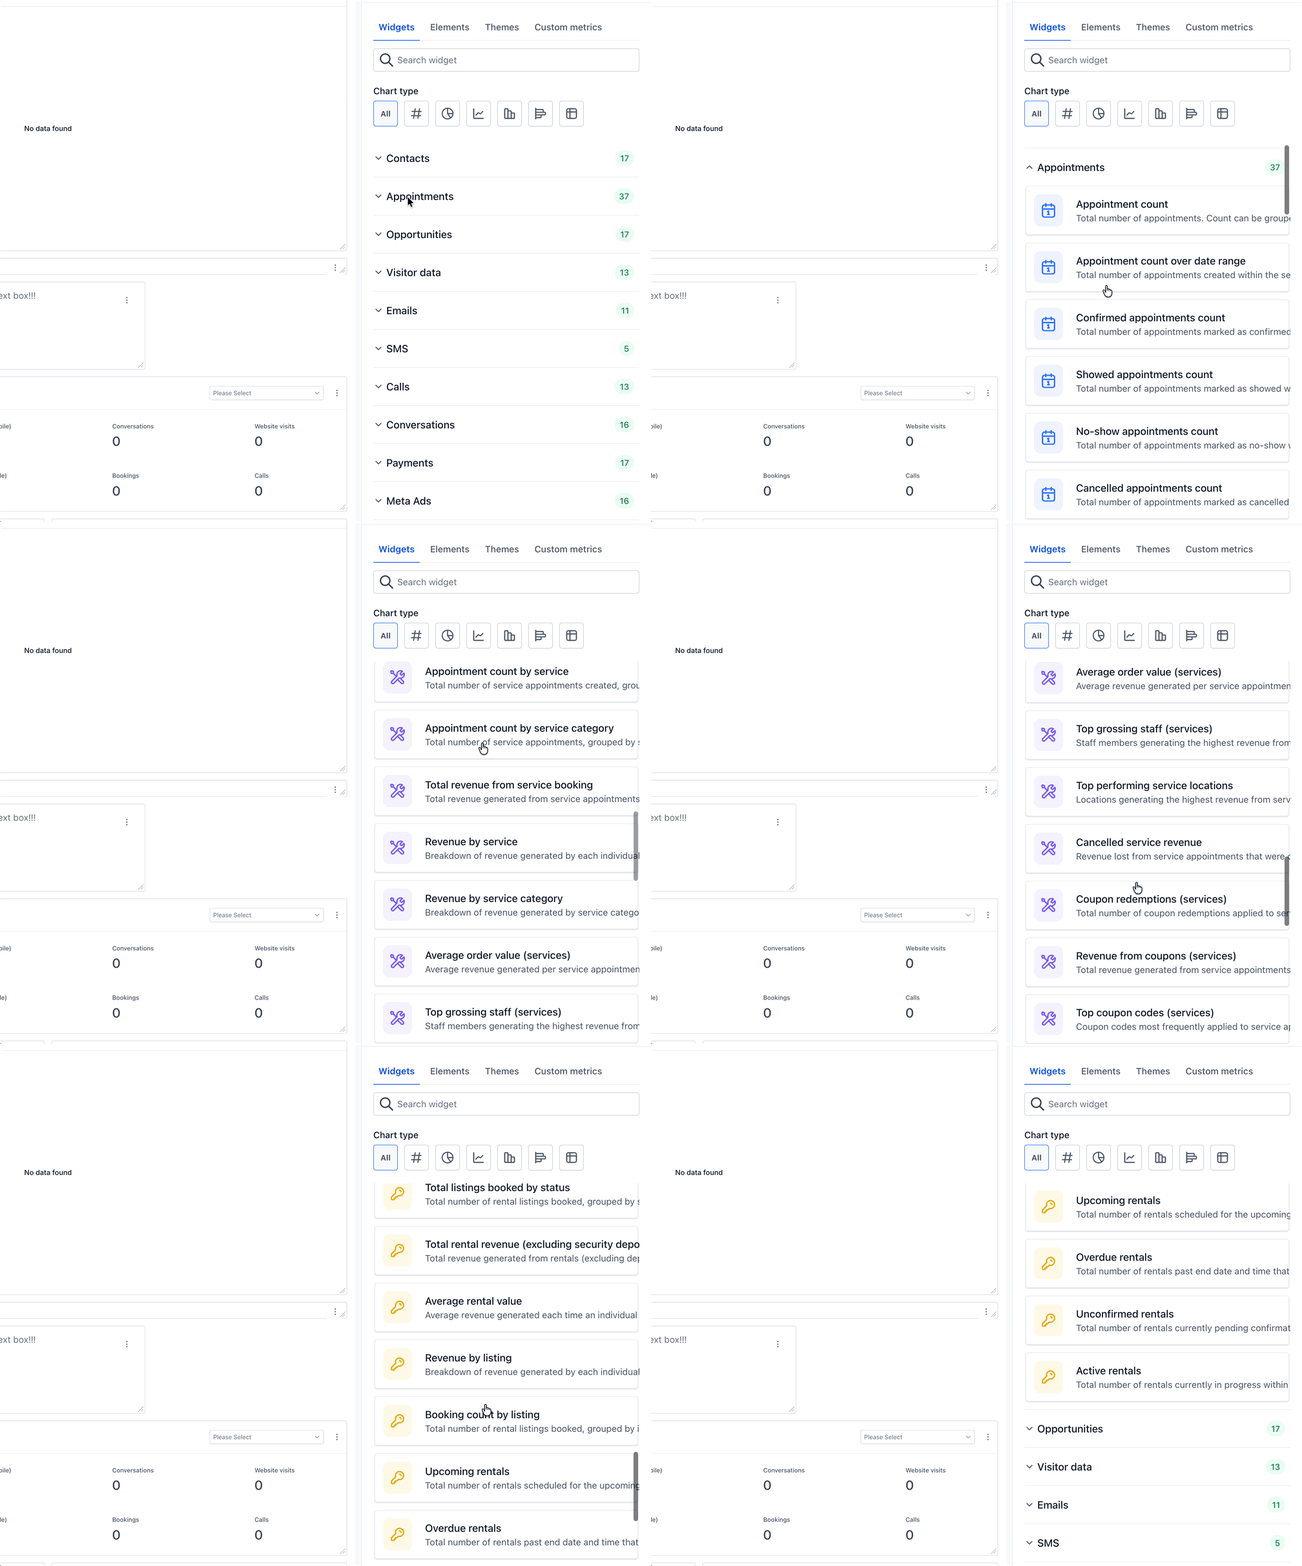
Services widgets display a purple wrench icon, while Rentals widgets show a gold key icon. This makes them easy to distinguish when scrolling through the Appointments widget list.
Once added, you can resize, move, and configure the widget. Choose your chart type (number, bar, donut, table, etc.) and apply filters by date range, staff, location, service, or listing. The sections below explain what each widget does and when to use it.
For a general overview of how dashboard widgets work, see What Are Dashboard Widgets? and Customizing Dashboard Widgets.
Customizing Service Appointment Widgets
Service Appointment widgets help you track revenue, staff performance, and discount usage for service-based bookings. These widgets draw from the Services scheduling type in Calendars, keeping them separate from traditional Meetings and Rentals.
When you add a Service widget to your dashboard, you can configure its chart type (number, bar, donut, table, etc.) and apply filters by date range, staff, location, service, or category. This lets you create focused views for different audiences—such as an owner's revenue overview or a staff member's individual performance.
Shows total revenue from all service bookings in the selected date range.
Use this to monitor overall sales from services across all staff and locations.
Breaks down revenue by individual service offering.
Perfect for spotting which services are your top earners and which may need more promotion.
Groups revenue by service category.
Helpful when you organize offerings into categories like "Consultations," "Treatments," or "Packages."
Displays average revenue per service booking.
Watch this metric when you introduce upsells, add-ons, or new pricing strategies.
Ranks staff members by revenue generated from service bookings.
Use this for performance reviews, incentive programs, and workload balancing.
Shows service locations ranked by revenue.
Ideal for multi-location teams who need to benchmark branches against each other.
Tracks revenue lost from cancelled service bookings.
Helps you understand the financial impact of cancellations and refine confirmation and reminder workflows.
Counts total coupon codes redeemed across all service bookings.
Great for quick checks on how often discounts are used.
Shows revenue from service bookings where a coupon was applied.
Lets you compare the revenue impact of discounted vs. full-price bookings.
Lists most frequently used coupon codes for service bookings.
Use this to identify your best-performing offers and replicate their structure in new campaigns.
Combine multiple Service widgets on the same dashboard to build a complete performance view. For example, pair Total Revenue with Top Grossing Staff and Revenue by Service for a comprehensive executive overview.
Customizing Rentals Widgets
Rentals widgets provide visibility into booking volume, revenue, and inventory status for rental listings such as vehicles, rooms, equipment, or properties. These widgets respect the Rentals scheduling type, which is designed for multi-day bookings and inventory tracking.
Just like Service widgets, Rentals widgets can be configured with different chart types and filters. You can filter by listing, category, booking status, and date range to create operational dashboards for logistics teams or revenue reports for managers.
Shows total number of rental bookings created in the selected period.
A core volume metric to track how busy your rental operation is.
Displays distribution of bookings by status (confirmed, pending, cancelled, etc.).
Quickly reveals operational bottlenecks, such as too many pending approvals.
Shows rental revenue net of security deposits.
Displays "true" revenue from rentals, separated from refundable deposits.
Shows average revenue per rental booking.
Watch this during price tests, package changes, or new listing tiers.
Breaks down revenue by individual rental listing.
Identifies which assets are most profitable.
Ranks listings by number of bookings.
Highlights popular assets that may warrant price adjustments or additional inventory.
Lists rentals scheduled for the upcoming week.
Helps operations teams prepare inventory and staffing for the near term.
Shows rentals past their end date that are not yet completed.
Critical for minimizing loss, enforcing late fees, or triggering follow-up workflows.
Displays bookings pending confirmation.
Perfect for daily follow-up lists for your reservations team.
Shows rentals currently in progress.
Provides a real-time snapshot of assets that are currently deployed.
Build an operations dashboard by combining Active Rentals, Overdue Rentals, Upcoming Rentals, and Unconfirmed Rentals. This gives your team a complete view of inventory status and pending tasks.
Frequently Asked Questions
Was this article helpful?
That’s Great!
Thank you for your feedback
Sorry! We couldn't be helpful
Thank you for your feedback
Feedback sent
We appreciate your effort and will try to fix the article